
Hello friends, in today’s information I will tell you how many types of candle sticks are there in trading. We will try our best to answer all your questions with this information.
Contribution of candle stick in trading
Although there are many other patterns available in the market apart from the candle stick chart pattern, but the simplest and most easily understood pattern is the candlestick chart pattern, hence the first choice of all new and old traders and investors is the candle stick pattern.
Identifying Candle sticks
It is very easy to identify a candlestick. It is quadrangular in shape with a head and a tail which shows the prices of all shares and currencies in the market.
It comes in many colors but the most commonly used colors are red and green, where red color indicates a falling market and green color indicates a rising market.
Why do candlestick charts?
Now you must be thinking that Mohit has not told why to use only candle sticks pattern, so do not worry, we will tell you why candle stick is more useful than other chart patterns.
Because in this chart pattern, red and green colored boxes are formed whose size is not fixed. Small and big sizes are helpful in entering the market.
If a big green colored box is formed then it means that there will be growth in the market. If a big red color candle is formed then the market will fall.
“Whether the market will go up or down depends on the size and color of the candlesticks”
Types of candle sticks
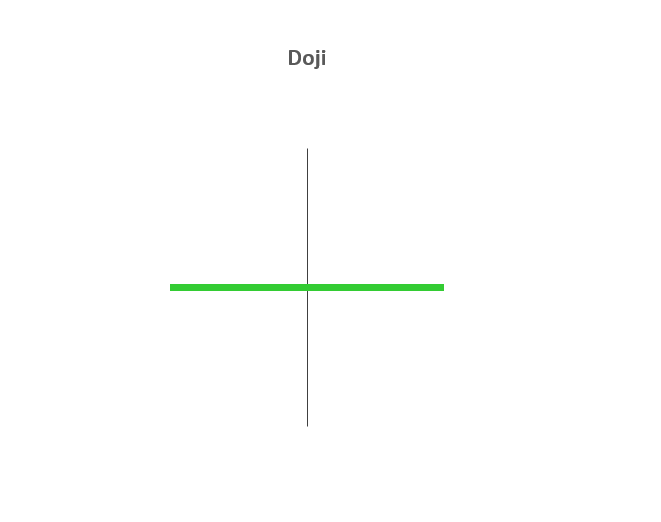
Doji – The Doji candlestick chart pattern is associated with indecision in the market. This means that the market is at the middle point from where it is and can go up as well as down.
This pattern can occur at the top of an uptrend, at the bottom of a downtrend, or in the middle of a trend.
The candlestick has an extremely small body located between the long upper and lower wicks.
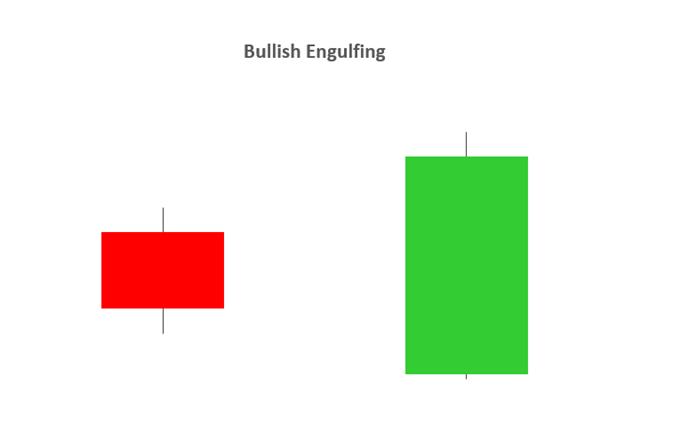
Bullish Engulfing – A bullish engulfing candlestick formation shows that the bulls have the upper hand over the bears. As the pattern below shows, the green body (bull) completely covers the first candlestick (bear).
Evening Star – Evening stars candlestick patterns occur at the end of an uptrend and signal a reversal pattern, respectively.
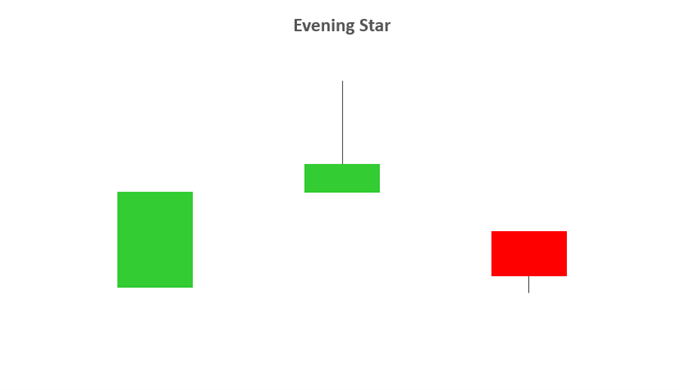
Evening Star –
Hammer – A hammer candle is seen as a bullish reversal that usually occurs at the bottom of a downtrend. This candlestick formation involves a small body so that the open, high, low and close are almost the same.
Below the body is a long lower wick that should be more than twice the length of the candle body.

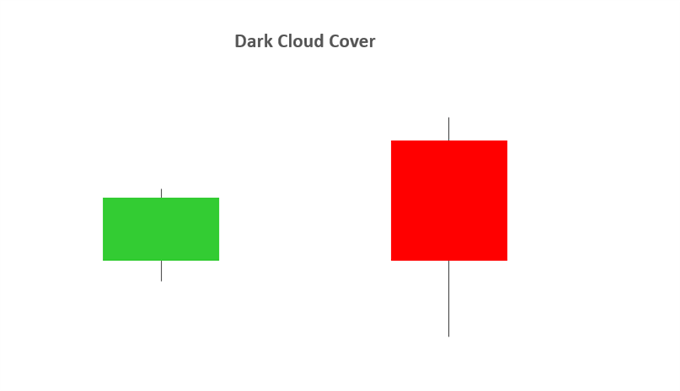
Dark Cloud Cover – The Dark Cloud Cover pattern is seen as a bearish reversal pattern.
Three white soldiers –
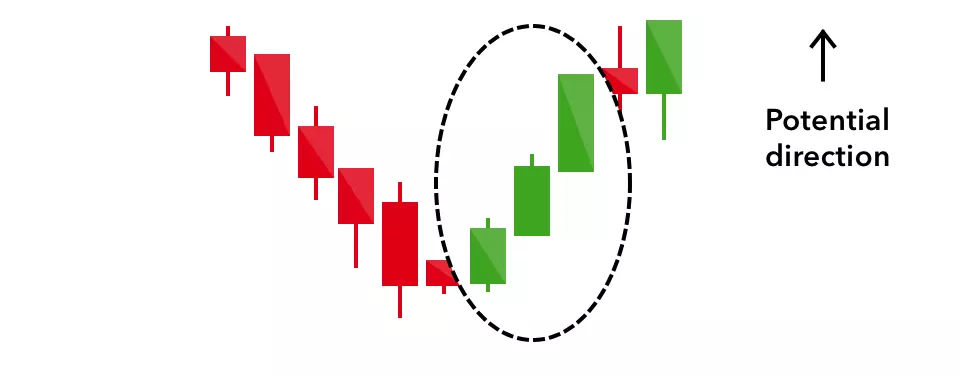
The three white soldiers pattern occurs over three days. It consists of consecutive long green (or white) candles with small wicks, which open and close progressively higher than the previous day.
It is a very strong bullish signal that occurs after a downtrend, and shows a steady advance of buying pressure.
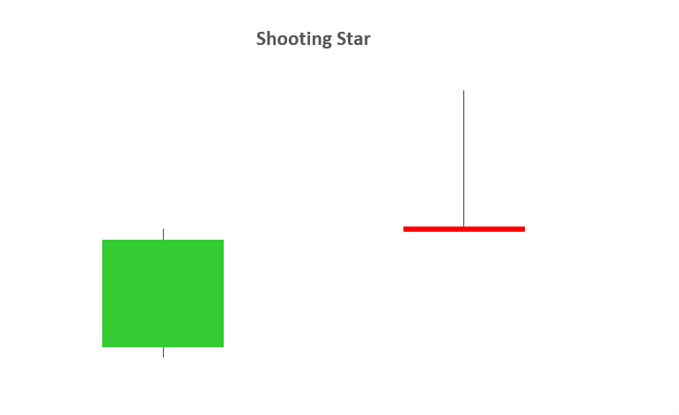
Shooting star – The shooting star is a bearish candle with a long upper wick, little or no lower wick and a small real body near the day’s low. It comes after an uptrend, and it signals a reversal of the trend to the downside.
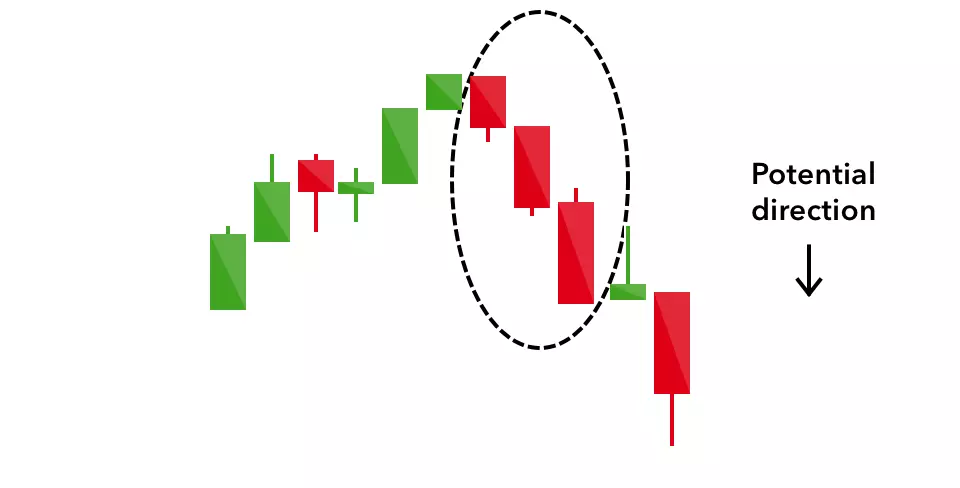
Three Black Crows – The three black crows candlestick pattern comprises of three consecutive long red candles with short or non-existent wicks. Each session opens at a similar price to the previous day, but selling pressures push the price lower and lower with each close.
Traders interpret this pattern as the start of a bearish downtrend, as the sellers have overtaken the buyers during three successive trading days.
Conclusion
Hope friends, you would have liked today’s information on Type of Candle Sticks in trading. Through this information, we have told you about identifying candle sticks and why they are useful in trading.